NetApp launches monitoring, alerting, and troubleshooting for ONTAP from the cloud

Share this page

Edward Barron
On September 16, NetApp is launching ONTAP® Essentials as an extension to Cloud Insights for all ONTAP customers as part of their Advisor level and higher support contracts.
With ONTAP Essentials you can monitor and visualize NetApp on premises or in a cloud-hosted storage infrastructure with all the benefits of software as a service:
- SaaS based solution—no on-premises footprint to procure or maintain.
- Scales to cover your entire worldwide enterprise storage infrastructure.
- Out of the box, zero configuration best practice monitoring and alerting.
- Unique capabilities—user-defined dashboards and monitors, power consumption monitoring; understand your storage performance and health in the context of virtualized compute.
In this first in a series of blog posts, I’ll show you how to get started with cloud-based monitoring. In subsequent posts I’ll walk you through connectivity with adjacent infrastructure like VMware, as well as how to customize your experience.
Getting started with Cloud Insights
If you’ve never used NetApp® Cloud Insights or Cloud Central before, go here to set up a Cloud Central account and access Cloud Insights for the first time. Sign up for the free trial, which will allow you to view your ONTAP systems and how they interact with Kubernetes, as well as to try any of Cloud Insights many other data collectors. After 30 days, if you choose not to continue a subscription to Cloud Insights Premium Edition, your tenant will be downgraded to Basic Edition.
Connecting ONTAP to Cloud Insights
Once you have set up an account, select ONTAP Essentials from the left navigation pane. Since this is your first time here, you see a page like the following.

Click the View All Available ONTAP Collectors link at the right to open a screen in which you can add your ONTAP system.

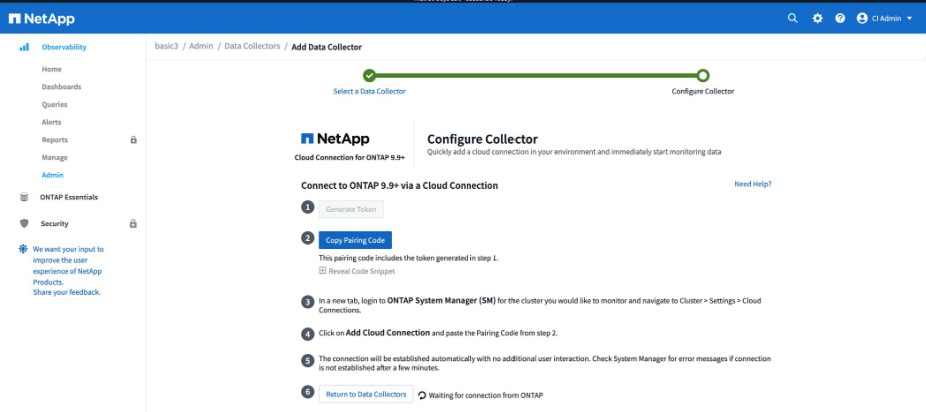
If you’re running a relatively current version of ONTAP on premises, or cloud-hosted Cloud Volumes ONTAP, you can connect to Cloud Insights directly. Select Cloud Connection for ONTAP 9.9+ or Cloud Volumes ONTAP. If you’re running an older version of ONTAP on premises, make an appropriate selection, such as ONTAP Data Management Software, to walk through setting up.
When you set up a cloud connection, Cloud Insights creates a secure token for the specific ONTAP system being connected. Copy the token and paste it into ONTAP System Manager. The connection process should automatically complete within seconds.

Enabling monitoring
When you add an ONTAP system, it shows up under ONTAP Essentials > Overview. We’ll walk through that addition in the next post. Now, let’s enable monitoring. Cloud Insights Monitors are rules that are checked whenever new data arrives and that generate an alert when a rule matches. The ONTAP experts here at NetApp have designed a large number of predefined monitors to help you keep on top of best practices for your systems.
Under Observability > Alerts > Manage Monitors you’ll see the ONTAP Infrastructure group of monitors. Click the three dots to the right of the group and then click Resume. This action starts monitoring all your ONTAP systems for critical infrastructure issues, from hardware failures to security. As a best practice, NetApp recommends enabling all monitors in this group. You can view the monitors in the ONTAP Infrastructure group to the right to find out more about them

When alerts occur, they are now available on the Alerts menu. They are available under both ONTAP Essentials > Alerts (ONTAP specific Alerts) and Observability > Alerts (all alerts).
How did the set up process work for you? Did Cloud Insights raise any alerts that you would have otherwise missed? Try out advanced features like Kubernetes while your trial license is active to see how Cloud Insights gives you end-to-end awareness from application to storage. And please share your experience in the NetApp Cloud Insights Communities.
In the next post in this series, I’ll show you how you can gain more visibility into your ONTAP infrastructure.
Edward Barron
Ed Barron is a technical director at NetApp responsible for ONTAP observability, remediation, reporting, and AIOps as delivered in Unified Manager, Harvest, and Cloud Insights. His background in both on-premises and cloud-hosted services helps to make sure that our products meet customers where they are as well as to accelerate their journey to cloud-hosted operations.